
P. Ikonomov, J. Rodriguez, A. Choudhury and S. Ramrattan
Western Michigan University, Kalamazoo, MI
Chemically bonded sand cores and molds are an important part of metal casting technology, and the mold-metal interface is of great technical interest to the industry. The metal casting industry has been placing a strong emphasis on near-net-shape and thin wall castings, while simultaneously maintaining increasingly stringent dimensional reproducibility requirements. The Thermal Distortion Test (TDT) has proven to be an effective laboratory testing methodology for measurement of distortion in chemically bonded sand-binder specimens, and to determine the presence of undesired casting features.
The TDT generates real time data of both axial and radial deformation due to thermal distortion of a disc shaped specimen. Though Thermal Deformation Curves (TDC) provide valuable insight to the nature of specimen deformation, it may be arduous to interpret the result by technical people not acquainted with the test. This paper presents a 3D visualization tool that can assist one in deeper comprehension of thermal deformation characteristics of the specimen. Specific benefit to foundry engineers is 3D graphical visualization of the deformation at various temperature and head pressure. The image produced can be used to define specific engineering strategies to prevent defects in casting, such as surface roughness, veins, penetration, cuts, washes, erosion and extreme distortion. Therefore, the development of the 3D visualization tool is another step in understanding of the core/mold metal interface and subsequent improvement of casting quality. Results for two specific sand systems is presented to illustrate the utility of the visualization tool.
INTRODUCTION
Precision sand molds and cores using chemical binders are the primary technology for the production of US automotive powertrain and certain aerospace components. Therefore, castings with defects produced from chemically bonded sand cores and molds are a major issues for the casting industry. Quality losses from the use of chemically bonded sand systems arises from several factors. One set of factors is the variation in materials itself, such as grain size and shape, chemical composition, binder level, and additives. Another set of factors include parameters for the process utilized for mold/core, including cold box, no-bake, hot-box, 3D printed, and injection molded. Process parameter variations are mainly work-time, strip time, pouring temperature, and metallostatic pressure. With an ever increasing focus on delivering near-net-shape castings, it is becoming crucial to develop advanced quality control approaches to compensate for such a wide range of variation sources.
Towards that end, Western Michigan University (WMU) has used for the past couple of decades a 50mm diameter, 8mm thick disc-shaped specimen as a supplementary foundry test specimen. Such specimen is a simple geometry, which is believed to be a key factor in reducing the inherent variability of sand binder system quality assessment metrics [1] . Specifically, these specimens have been shown to reduce measurement variabilities across a wide range of quality metrics for chemically bonded sands, namely; density, abrasion, impact, hot-permeability, thermal distortion, and fast loss of ignition. These non-standard tests have produced quality metrics that have proven to be useful in control of precision sand systems [1, 2, 3]. Various casting trials that use the same disc-shaped specimen have been used to complement the non-standard tests to try to establish a link between sand system quality metrics and defects, such as veining/penetration, gas, erosion or distortion at a specimen/metal interface [4, 5]. Studies have shown a relationship between casting surface defects (veins and penetration) and TDCs obtained with WMU’s TDT [4, 5]. Such results suggest that casting trial data can be integrated into a foundry’s quality control strategy to close the needed information loop.
One particular aspect that has been an issue with the TDCs is the difficulty in understanding the actual meaning of the information provided in them. Characteristics such as increase/decrease in magnitude of distortion and change in trend (i.e., slope) of the resulting distortions are source for most of the questions that technical people will have when looking at the TDC for a given sand binder specimen. These issues are mentioned whenever two different sand binder specimens are compared. Therefore, the aim of the work presented here compared. Therefore, the aim of the work presented here is to develop a 3D visualization tool that serves as additional aid to casting design engineers, by providing thermal distortion information in an understandable and useful manner.
The methodology of 3D visualization of a body has evolved over the years. In this paper, a study of the thermal distortion of sand mold utilizes a 3D model for visualization and simulation of the physical system is presented. Finally, the model and simulation data is exported to a virtual reality and rendering system for creating the 3D visualization executable program.
BACKGROUND
The starting point for the use of the proposed 3D visualization tool is the data collected from the TDT experiment, and the profiles scanned at the start and end of the TDT experiment. The following is the methodology to collect the data, which is used to implement the 3D visualization process.
Thermal Distortion Test (TDT)
The TDT is suitable for measuring thermo-mechanical behavior, specifically distortions, of chemically bonded sand systems. The test temperature on the TDT apparatus is variable and can be set to mold-metal interfacial temperatures for a specific alloy, such as aluminum 700°C (1292°F) or cast iron 1200°C (2192°F). Similarly, different loading pressures can be applied to the specimen to simulate different metallostatic pressures on the core/mold material. After exposure to the temperature, if the test specimen remains unbroken, additional information is acquired, such as the presence of cracks (which causes veining), weight loss that relates to binder pyrolysis, and the amount of loose unbonded sand at the mold-metal interface [3].
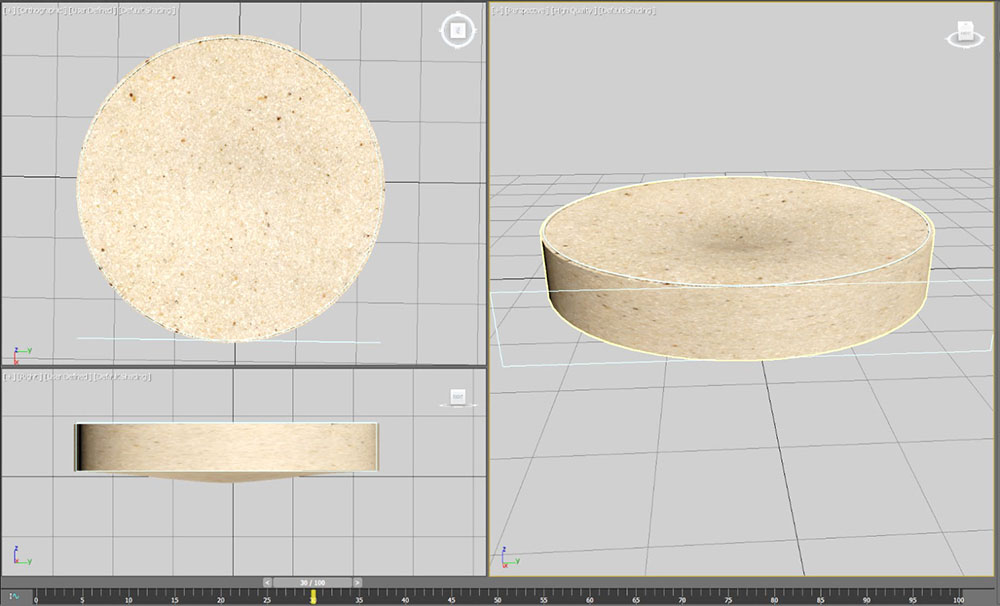
Dimensional Data. The specimen used for in the TDT is a disc that has nominal dimensions of 50 mm in diameter and 8 mm in thickness. During the experiment, dimensional data for the specimen was collected using a non-contact measurement tool.
Thermal Distortion Test Data. Directional heating of sand composites (mold and core media) generates anisotropic thermal gradients in materials. When shaped sand composites make contact with molten metal, heat is transferred from the metal to the sand causing thermo-mechanical-chemical reactions and resulting in dimensional deformation and shape distortion. Specifically, thermally induced reactions of the binder occur simultaneously along with sand expansion and/or plastic deformation leading to distortions in the sand core or mold [1]. For certain chemically bonded systems such as organics, reactions generally include the release of volatile materials, possible core strengthening reactions from secondary curing, and core weakening from pyrolysis can occur. It is important to understand that when acquiring the data, distortions can also be caused by the binder or aggregate.
3D Measuring Macroscope
With conventional measurement equipment (e.g., profilometers, human vision inspection) significant time and skill are required to achieve repeatable and reproducible dimensional measurements from the disc-shaped specimen, particularly after elevated temperature exposure. Furthermore, for the post-test data, it is challenging to obtain measurements of distortion, surface texture, and roughness measurements within difficult-to-reach areas, such as cracks.
For profile data collection, a non-contact 3D Measuring Macroscope was utilized. This measurement system also allows the surface of the disc-shaped specimen to be captured at ambient or elevated temperature [6].Through the use of the 3D-Macroscope and its accompanying software, high-speed, high-accuracy 3D measurement can be obtained. Figure 1 shows images collected by the 3D-Macroscope of the surface of a disc-shaped specimen and a casted metal disc specimen.
Figure 1: 3D-Macroscope measurements for surface of the disk specimen and a cast specimen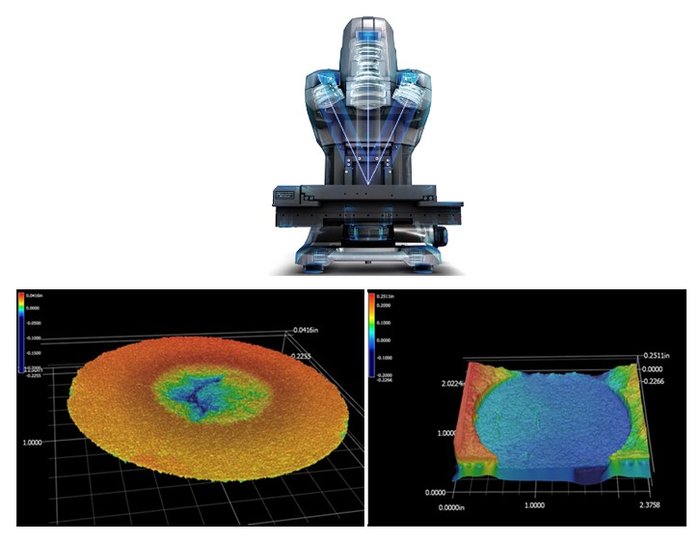
Other Test Data.
Apart from the distortion data, other data is collected when performing a TDT, mainly: mass changes that relate to pyrolysis of binder and the amount of loose unbonded sand generated at the mold-metal interface were measured. The percent change in mass (degradation losses), cracks (related to veining and penetration), and thermal distortion (mold wall movement) varied between the two sand binder systems. These anomalies ultimately have an effect on casting surface quality. The data from the aforementioned technologies is integrated into the proposed 3D visualization tool.
Visualization Tool.
The proper 3D visualization of TDT data is important to understand the volumetric transformation that occurs during the time of the test. It is essential that such visualization is based on the actual data measurement. There are two main resources of the data, the first one is the real-time data collection of the axial and radial displacements during the TDT; and the second one is profile scanning, which is performed with 3D-Macroscope on the actual specimen before and after the TDT.
OBJECTIVE
The objective of this development work is to have a visualization tool that utilizes TDC data, scanned profiles, and other measurements to display 3D representations for various sand binder systems under thermal effects. The visual aids will be valuable understanding of the relationships between the sand binder system and the molten metal, at a specific temperature and head pressure. Additionally, such representations will serve as an aid in diagnostic tasks regarding the quality of the casted part. The ultimate objective is for foundry engineers to use information from 3D representations to find sustainable benefits for designing quality near-net-shape castings.
METHODOLOGY
The complete proposed procedure for the use of the developed visualization tool consists of the following major steps:
1. Fabrication of the specimens with specific sand binder mixture
2. Characterization of disc-shaped specimens, including profile analysis
3. Testing of the specimens with Thermal Distortion Test (TDT) technique
4. Collection of post-test data (observations and profile analysis)
5. Application of 3D Visualization Tool.
In the present work, specimens of a phenolic urethane amine cold box (PUCB) and a 3D printed furan (FUR3D), and studied at cast iron temperatures. The details for each fabrication process is given next.
1. Fabrication of Specimens
Disc-shaped -specimens (50 mm in diameter by 8 mm thick) were provided by two different manufacturers. The manufacturers used dissimilar specimen fabrication techniques, sands, binder levels, and chemistries. The chemical sand binder systems used were not optimized for the casting alloy, fill temperature, or head-pressure. Such conditions were desirable in order to point out potential differences in distortion results, and potential resulting defects among the systems.
PUCB Specimens. The PUCB disc-specimens were prepared by blowing them with a laboratory core blower into a core box. All specimens were produced at ASK Chemicals.
Materials. The sand was a washed and dried Wisconsin round grain silica sand 65 GFN, 3 screen, roundness/ sphericity (Krumbein) 0.8/0.8, pH 7.1, acid demand 0.8 and the total Polyurethane binder level was 0.9% B.O.S.
Procedure. The following steps were performed for the fabrication of the specimens:
a) Add weighed sample of sand to DeLonghi Mixer
b) Make two pockets in the sand
c) Add Part 1 component into one pocket and Part II to the other pocket
d) Mix for 1 minute
e) “Flip” mixture and mix for 1 additional minute
f) Using laboratory core blower set at 0.379 MPa (55 psi) for 0.5 second blow the mixed sand into the four cavities of the core box
g) Cure by gassing with TEA using a Luber gas generator. Gassing parameters: 1 sec gassing with TEA, followed by an air purge for 6 seconds (gas pressure was 0.172 MPa (25 psi) and air purge pressure was 0.103 MPa (15 psi)).
FUR3D Specimens. The disc-specimens were 3D printed at ExOne, Troy, MI.
Materials. The sand was a washed and dried round grain silica sand 80 GFN, 2 screen, roundness/sphericity (Krumbein) 0.8/0.8, pH 7.0, acid demand 0.8 and the total Furan binder level was 1.4% B.O.S.
Procedure. The 3D Printed specimens were prepared on an ExOne S Max #8. FUR3D printed disc-shaped specimens were produced within the same build-envelope. Processing parameters such as binder level, recoater angle, and print speed were controlled.
2. Pre-test Specimen Data.
Prior to elevated temperature exposure for both the TDT and casting trials, each specimen was weighed and dimensionally characterized with the 3D-Macroscope [6].
3. Thermal Distortion Test (TDT)
The standard TDT procedure was applied to both sets of specimens. The complete procedure has been previously documented in the AFS Transactions [1-5]. Figure 2 shows a schematic representation of the TDT. Specific conditions for the present study are as follows:
• The temperature of the TDT was set to1200 ± 5°C. The set temperature represents the cast iron/sand mold interfacial temperature that was used in the casting trials. The temperature was controlled using a K-type thermocouple at the hot surface.
• The load on the TDT was set the 3.5N. The load set represents the head pressure, which is the pressure that the molten metal acts upon the mold’s surface area. The 3.5N load represents a 150 mm (6 in) cast iron head height. This particular head height was used to represent a head pressure typical with small to medium size iron castings. The load is calculated by the contact area of TDT’s hot surface (20 mm diameter) times the specified head pressure.
Figure 2. Schematic representation of the TDT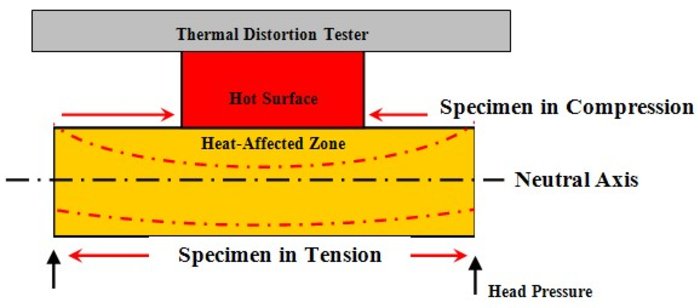
The disc shaped specimen was inserted into the pivoting gimbal designed for holding it firmly during the test (Figure 3). The test piece is automatically raised until direct symmetrical contact was made with the hot surface. Raising the gimbal simultaneously engages the linear voltage displacement transducer (LVDT) and a laser for measuring the distortion axially (i.e., thickness direction). The data acquisition system automatically logs and plots the distortion/temperature versus time curves. The duration of the TDT is 90 seconds.
Figure 3. Pictorial showing specimen mounted on gimbal for the TDT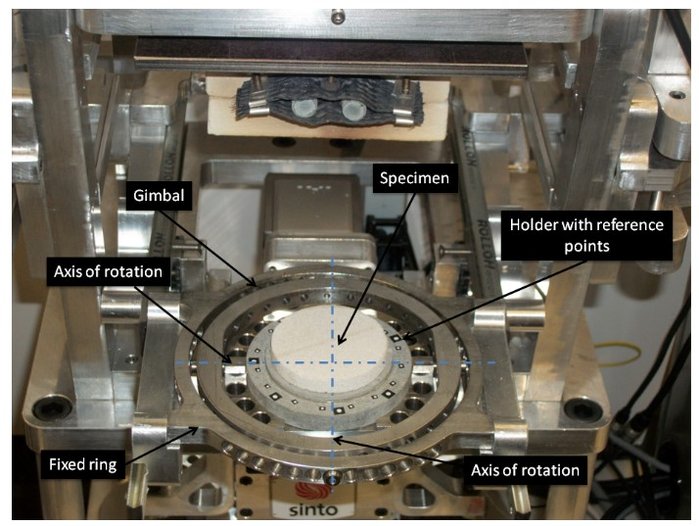
During the test, the predetermined load chosen to represent the force of molten metal pressing against the mold/core wall, presses on the gimbal, which is in contact with the circumference of the specimen, which presses the top of the specimen against the 20 mm diameter hot surface. Any downward movement of the gimbal is recorded as expansion. Any upward movement of the gimbal, due to the specimen becoming plastic and distorting is recorded as plastic distortion. When the gimbal movement is plotted, the positive direction represents the expansion of the specimen and the negative direction represents the plastic distortion of the sample.
All specimens were tested in laboratory conditions. Ambient conditions were controlled: temperature at 20 ± 1°C and relative humidity at 50 ± 2 %. The TDT was performed to specific numbers of specimens, and the resulting TDC for each case was obtained.
4. Post-test Specimen Data.
Following elevated temperature exposure in TDT the surface of the specimen was blown with 0.03 MPa air pressure to remove any loose sand grains. The specimens were weighed, and the percent change in mass was recorded. Next, all test specimens remaining whole are subjected to the scanning process, which is performed with the 3D-Macroscope. In addition to the information about thermos-mechanically induced distortion, this step allows for information to be gathered regarding surface roughness, area affected at the hot surface interface, discoloration [6], and measurement of any cracks and sand binder losses. All these factor are taken into account for classification purposes, and for the future goal of having a predictive tool.
The measurements done on the 3D-Macroscope follow the best fit method. The best fit method analyzes the entire surface and aids in determining any volumetric change after elevated temperature testing. The fixture used to hold the disc-shaped specimen at leveled references for the use of the 3D Macroscope is shown in Figure 4. Three specific measures were obtained with the 3D-Macroscope, including:
a) Surface roughness, Ra µm of the disc-shaped specimen.
b) Hot surface/specimen interface after TDT and the heat-affected-zone.
c) Distortion based volumetric change on of the disc-shaped specimen.
Figure 4: The disc-shaped specimen being held in this fixture for all measurements done on the 3D-Macroscope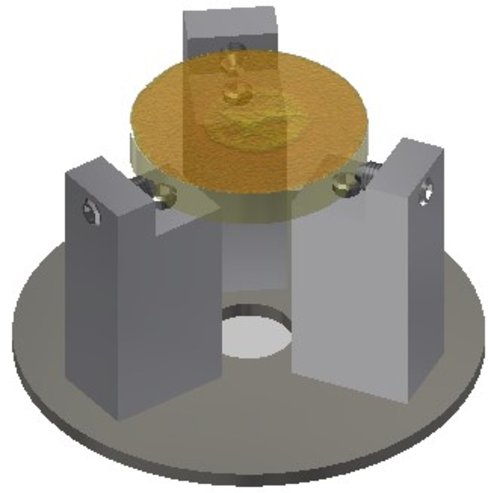
5. Use of 3D Visualization.
The final step in the procedure is to use the data from TDCs and from 3D scan as input to the 3D visualization tool. This is done by referring to the specific files containing the information, which then will be read by the visualization tool, and the first graphical display is generated. The main steps followed to apply the 3D visualization tool are:
a) Reference TDC data and scanned data in respective files
b) Specify augmentation factor, and specific time for display of standard visual representations
c) Manipulate display to desired views
d) Save desired display.
The files containing the TDT data are in Excel format for the TDCs, and in 3D graphics format (Step, OBJ or STL) - for scanned data. The scaling factor is in order to have visually different displays for before and after TDT, and therefore be able to differentiate between both states or even during the performance of the TDT. It is required to have a specific time for the initial display, it can be any specific time of interest, or even a random number between 0 and 90 (corresponding to the duration of the TDT, in seconds). This requirement is only for the initial display, once such display is generated the user has the ability to move to a different time by means of the sliding scale provided in the visualization tool. The standard 3D views displayed are three, the front (i.e., 2D rectangular shape for a disc specimen), top (2D circular shape for disc specimen), and isometric (3D view). Each one of those views can be modified in order to display specific desired features of the specimen during the TDT. The option to save a file with the generated display is by means of a printout option, or a screenshot. The 3D visualization tool has been developed using a commercial graphics package, which implies that such software needs to be available in order to apply the tool.
RESULTS AND DISCUSSION
Results obtained from the testing and visualization phases are presented in this section. As indicated before, the specimens for two different sand binder systems were fabricated by outside companies, and after their characterization, they were tested and the results visualized. Results and discussion are as presented below.
TDT Results.
The TDCs for each one of the two sets of specimens are given in Figure 5 and 6. The first figure illustrates typical axial (i.e., vertical) relative displacement of the PUCB and Furan specimens, and the second figure illustrates the radial (i.e., horizontal) relative displacements. For axial or longitudinal distortion (Figure 5), both sand binder systems showed undulations that indicate thermo-mechanical and thermo-chemical changes in the binder system at elevated temperature. There is an initial expansion, however, PUCB showed vivid plastic deformation after approximately 30 seconds of testing while expansion in FUR3D continued for the duration of the test. In the case of radial distortion (Figure 6) showed that PUCB had larger magnitudes of radial displacement all through the 90 seconds of the TDT. The differences in distortions between the two systems is a reflection of the differences in their corresponding sand binder systems.
Figure 5: TDC for axial (longitudinal) displacement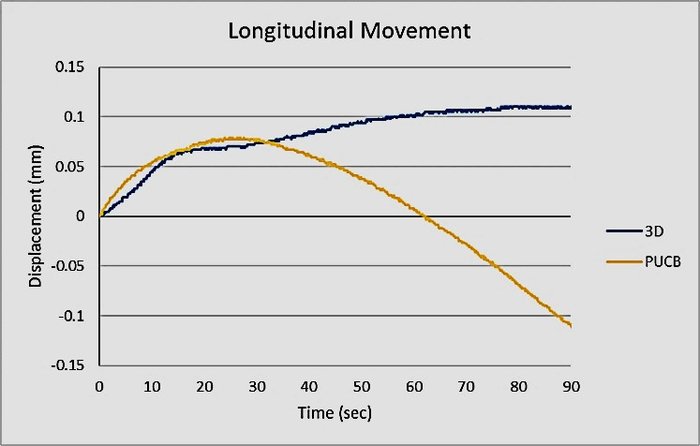
Figure 6: TDC for radial displacement.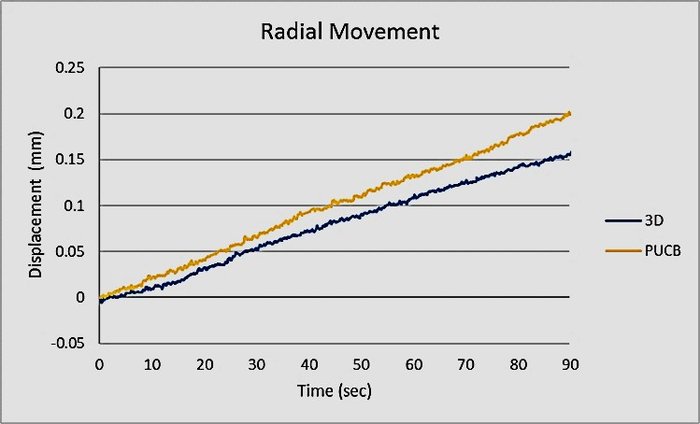
Some of the data collected after the performance of the TDT is presented in Table 1. The figures given in the table are the final magnitudes of distortion after the TDT, as well as an index that captures the total distortion suffered by each sand binder system in each direction. Additional inspection of the specimens resulted in the observations listed in the table as well.
Table 1. Results from the TDT of various chemically bonded sand systems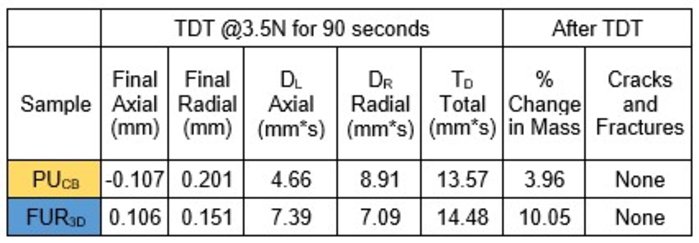
3D Macroscope Results.
The profile scanning of the specimens before and after TDT are obtained, and typical pictorials given in Table 2. The table shows as well numerical information regarding the surface roughness and the volumetric change of the specimen. The change in volume is based on the scanned data, and the volumetric difference of the FUR3D specimen was the lower than the one for PUCB. The heat-affected zone in the specimens of sand with organic binders reveals unbonded sand where the binder had been completely pyrolyzed but remains intact because the specimen is undergoing compression against the hot surface at that location. However, cracks and fractures become evident after blowing away the loose grains of sand.
Table 2. Sample of pictures of 3D-Macroscope observations before and after TDT for specimens tested, together with pot-test data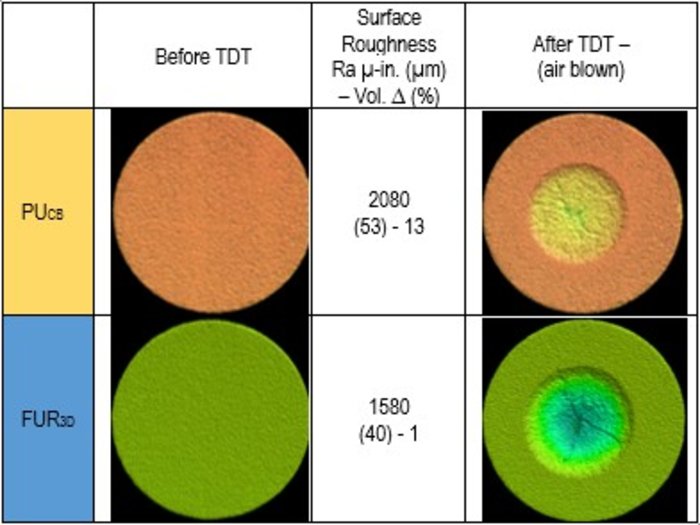
3D Visualization Results.
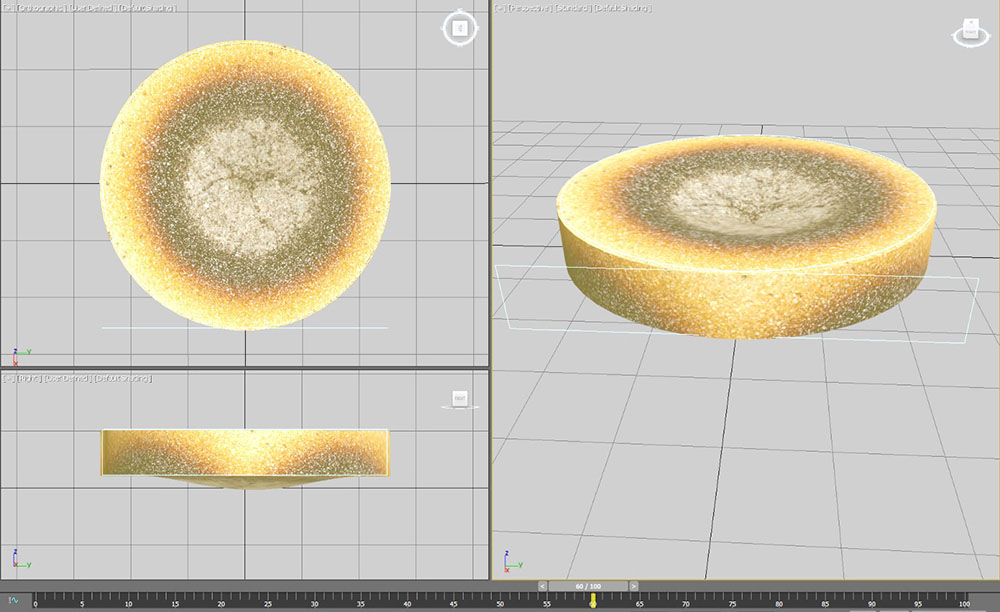
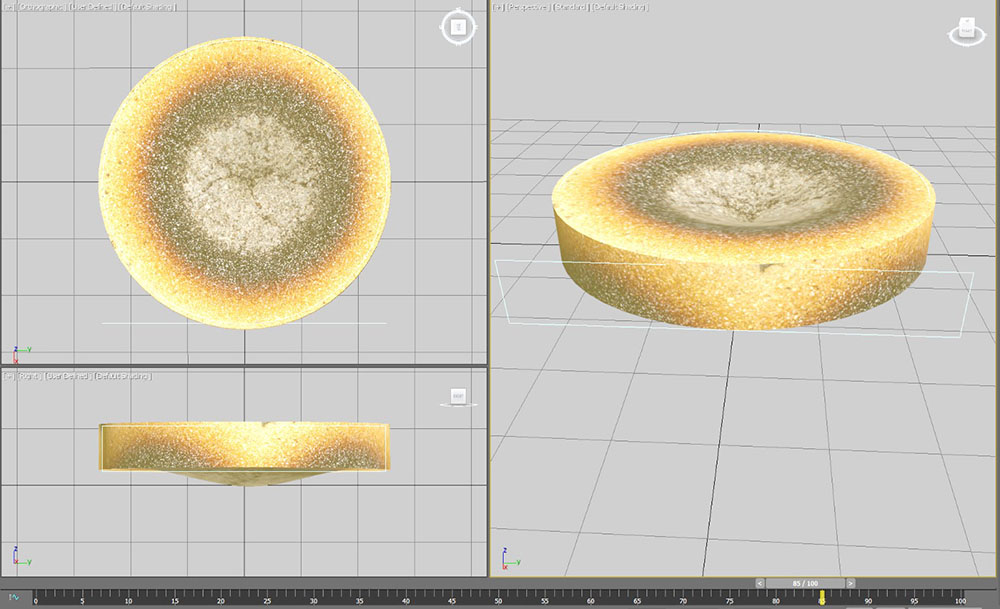
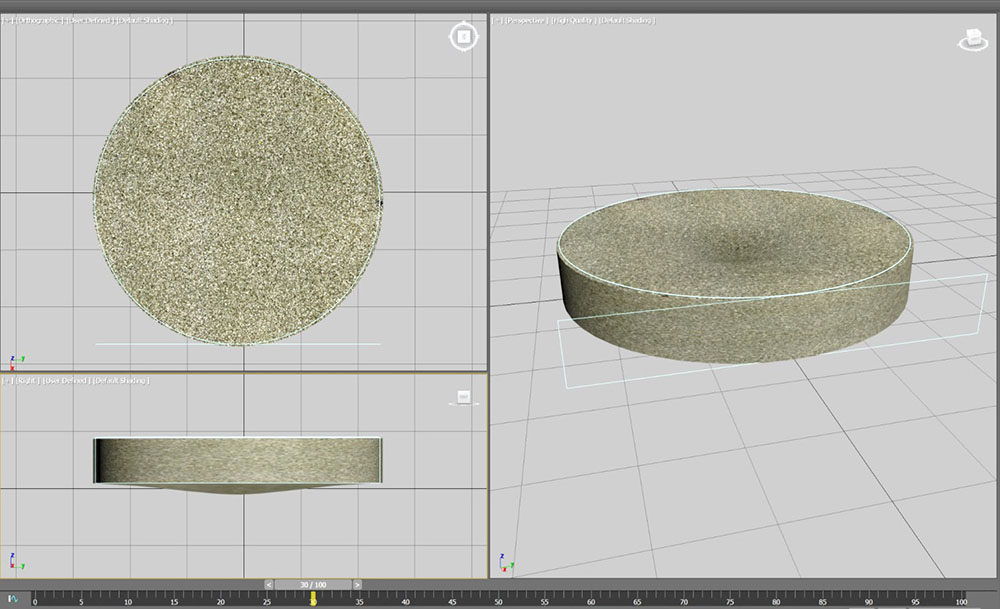
Once the testing and observation data is collected, it can be used to drive the visualization tool. The two main sets of data given above are used to display the actual distortion suffered by each one of the two sand binder systems tested, i.e., PUCB and FUR3D. For each case, it was selected displays at 30, 60 and 85 seconds. The reason for the third selection is to show the state of the specimen just before the test ends. Figure 7 (a), (b), (c) and (d) show screenshots the displays for each one of the selected times applying the data for PUCB. The displays show the original shape with white borders for reference (time = 0) and comparison for the selected time. These white borders remain unchanged during the visualization phase. The scaling factor specified in these cases was 10x, and the standard views were kept and saved. It can be observed that as the TDT progresses, there is a change in the magnitudes of distortion which is illustrated in the visualization tool.
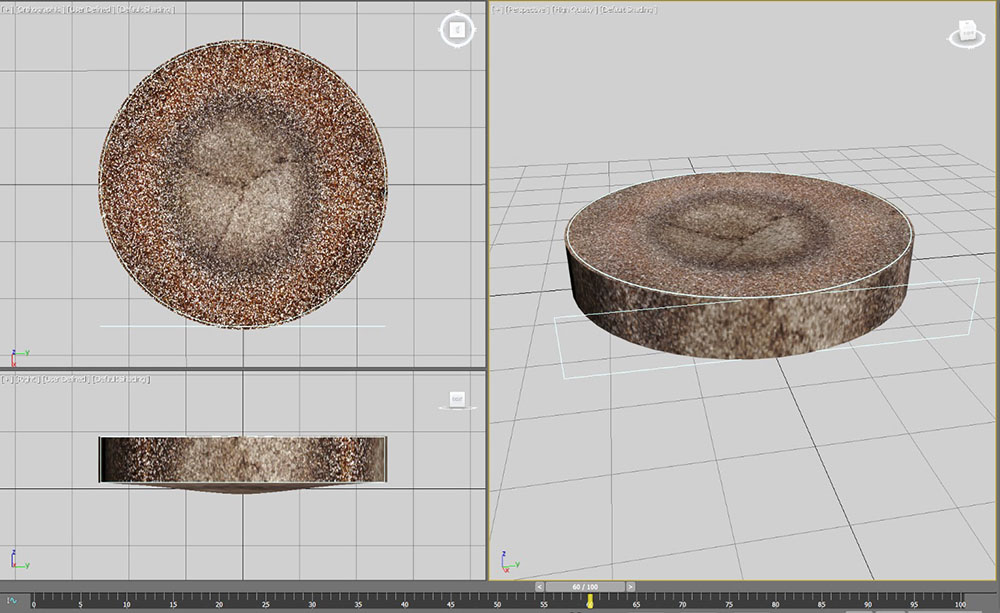
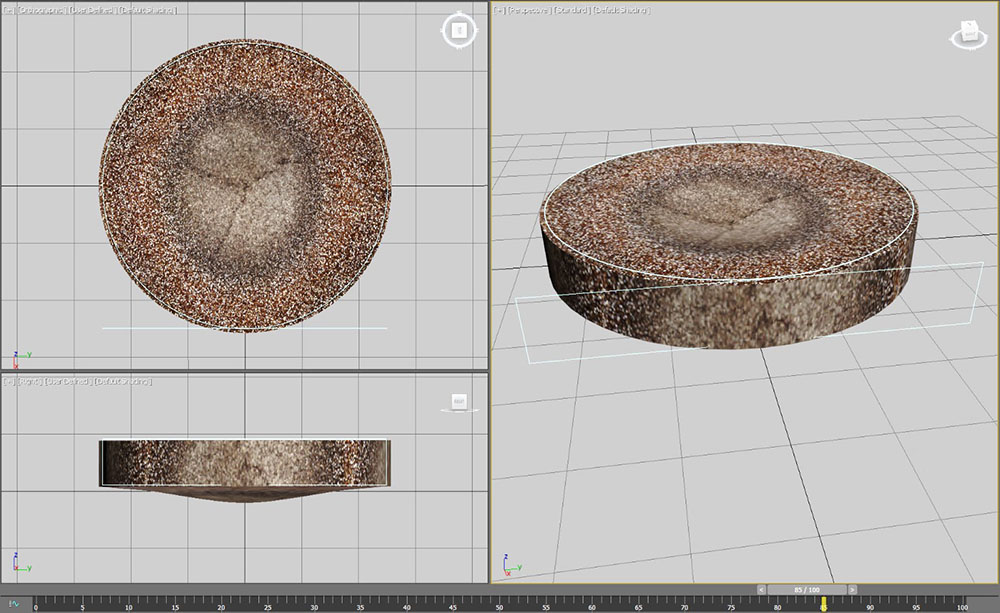
Similarly, Figures 8 (a), (b), (c) and (d) show the corresponding screenshots for the FUR3D sand binder system. The same changes, specifically in terms of axial and radial displacements, are evident in the sequence of displays as the test progresses. It is important to indicate that interpolation techniques are applied for the full definition of the displays at a specified time during the test. The interpolations are applied in order to have complete data, as required for the visualization tool. There are two interpolations, one for numerical data from the axial TDCs, and the other for the scanned data during TDT. The data collected during TDT for the axial and radial displacements is based on one sensor in each direction, which implies that is displacement of one specific location in the specimens, this locations are the center of the disc and midway thickness, for the axial and radial measurements, respectively. Therefore, in the case of axial distortion, the interpolation is based on the assumption that the specimen will behave as homogenous material and it will undergo standard plate bending during the TDT. For the radial distortion the assumption is to have the same value of displacement assigned to all locations in the outer surface of the disc specimen.
Regarding the scanned data, the procedure is to have scanned profile before and after TDT, not during the test, hence the need for interpolation for the creation of dynamic data at any time in between.
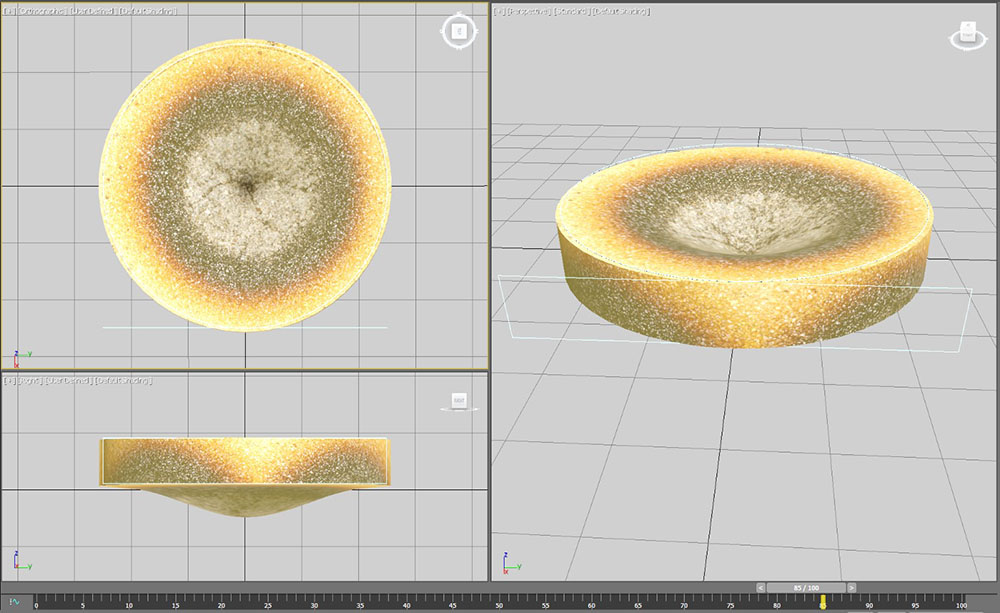
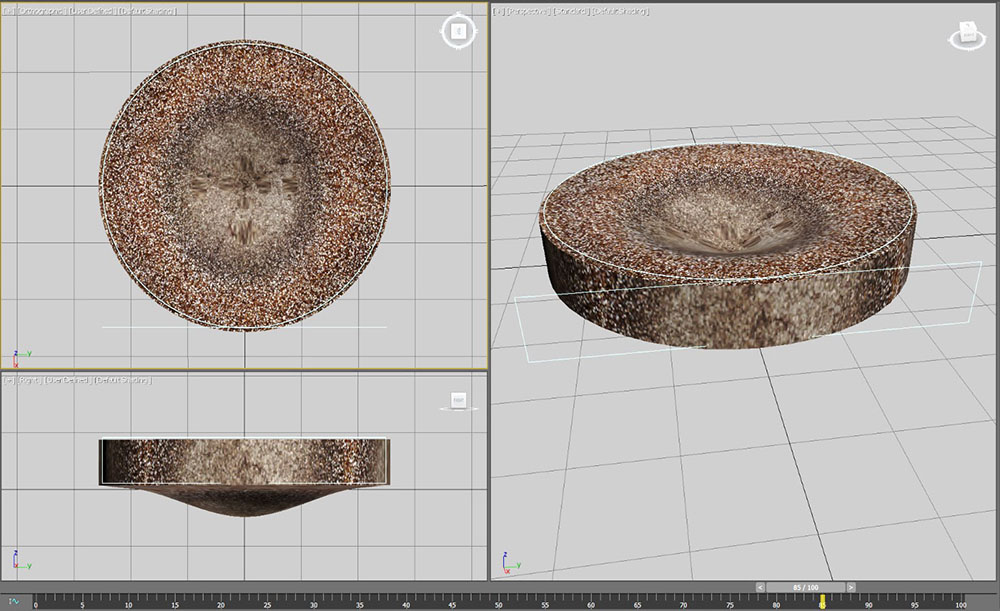
To illustrate some of the options that the user can utilize while visualizing distortion data, Figures 7(d) and 8(d) shows a screenshot for the PUCB and FUR3D sand binder system when a larger scaling factor is applied, in these cases double or 20x. The need for the scaling factor is due to the relatively low magnitude of the distortions recorded, and its importance in a visualization tool is because the comparative effect needs to be observed. Additionally, the displays shown in Figure 9 correspond to various views generated interactively by the user. The user can select the view that wants to change, that is, it selects a particular viewport or sub-window, and with the use of the mouse or the keyboard, the actual view can be modified. Thus allowing for a better perspective that results in better understanding of the behavior of the specimen under thermal loads. At any time during the visualization phase, the user can restore the standard views.
The display in the graphics windows provides the user easy control of the data to be displayed time wise. The control is given with the sliding scale provided at the bottom of the graphical display, the user can interactively move to any time from 0 to 90 seconds, the duration of the test, and the tool will display the corresponding distortions in the specimen. Thinking as well that this visualization tool is something that users will not be applying often, it is very likely that its functions and way of operating it can be forgotten. A non-intrusive help menu within the 3D visual space allows the user to review the commands and operations possible with this visualization tool without any need for written manual or personalized training. The developed visualization tool provides full inactivity in time and space for the user and does not require any special knowledge on how to generate actual test or interpolated data.
The 3D visualization tool will help users to better understand the results from the TDT, thus allowing them to have better information regarding a particular sand binder system under given temperature-load conditions, and make more educated decisions. The visualization tool uses common graphics packages, virtual reality visualization for use with the 3D stereo display or head mouthed display (HMD) can be achieved very easy, it is just a matter of saving the executable file from the graphics package to the desired format. In addition, the visualization can be saved to platform independent formats.
It should be noted that the work in this paper represents the data for two chemically bonded sand systems at cast iron temperatures and a pressure representative of a medium size casting. There are numerous other sand binder systems from which additional data could be gathered to learn more about their thermo-mechanical properties.
CONCLUSIONS
Thermal distortion is the expansion, contraction, and degradation experienced by a mold or core under extreme heat and liquid pressure of the molten metal, and such disruptions might result in casting surface defects. TDT is a safe, quick, and cost effective technique for monitoring thermal distortion in chemically bonded sand systems. However, the current interpretation of TDT curves as 2D graphs is not an easy task.
A 3D visualization tool based on TDT and 3D Macroscope data has been presented in this paper. The implemented visualization tool allows interactive displays of the distortion suffered by a specimen subjected to the TDT. The visualization is based on the data collected for axial and radial distortions, as well as the before and after TDT profile scans.
It is planned to have a visualization tool that eventually will provide behavioral maps for various sand binder systems, thus allowing for better selection of such components based on the application at hand. The implemented 3D visualization tool is an important aspect providing foundry design engineers with simple imagery compared to the more laborious numerical data. The goal of this endeavor is to help foundries in the production of near to net-shaped castings.
REFERENCES
1. Ramrattan, S., A., M. Khoshgoftar, M. Konkel, J. Muniza and A. Pike, “Improvements to Disc-Shaped Specimens for Control of PUCB Sand Systems”, AFS Transactions, No. 14-061 (2014).
2. Iyer, R., Ramrattan, S., Lannutti, J., Li, W., “Thermo-Mechanical Properties of Chemically Bonded Sands,” AFS Transactions, vol 109, pp. 1-9 (2001).
3. Oman, A. J., S. N. Ramrattan, M. J. Keil, “Next Generation Thermal Distortion Tester”, AFS Transactions, 13-1454 (2013).
4. Ramrattan, S., Derrick, S., Nagarajan, K, Iyer, R., “Comparing Casting Evaluation to Thermal Distortion Testing for Various Chemically Bonded Sand Systems Using Image Analysis,” AFS Transactions, 11-033 (2011).
5. Derrick, S., Oman, A., Ramrattan, S., “Casting Trials Measuring Thermo-Mechanical Defects in Various Chemically Bonded Sand Systems,” AFS Transactions, 12-107 (2012).
6. Keyence, One-shot 3D Measuring Macroscope, VR-3100, www.keyence.com
×
